Search This Blog

Monday, November 19, 2012

Post-construction boom plan?


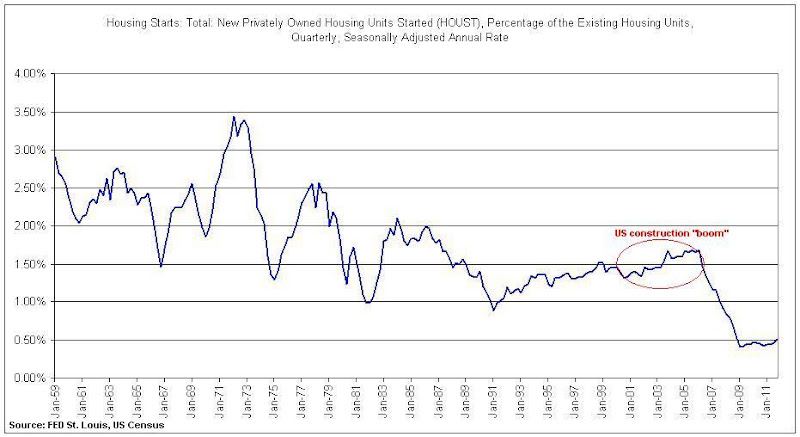
There is a lot of talk recently about RBA's new great idea of replacing the mining boom with a construction boom. It is quite possible that could work, and we continue growth by shifting ex-mining investments into housing construction. This is not new idea. It was very "successfully" implemented in quite a few places around the world recently. Irish and US governments successfully replaced IT boom of late 90s with period of steady growth driven by construction boom. Chinese government partially did the same thing after their export boom ended. Historically, it seems it's quite easy to succeed with this plan.


BUT, there is one much more important question that nobody seems to be asking  in Australia: even if the great idea of construction boom replacing mining succeeds, what will replace construction boom at its end in three or five years? 


If everything goes as planed, in just 5 years we will have million more homes - half of them empty (around half a million more new homes than new households), we will have around half a trillion more debt (half a trillion less invested in productive business and infrastructure) Maybe we can continue doing the same for 5 more years after. By than we should have million more empty homes and trillion more in debt.

BUT, what will happen after we take more debt and misallocate it into more empty houses? What is the great idea promises us after?

I'm scare even to think about this.
I hope our government's great ideas fails quickly. I hope for that not because I think we will be fine if it fails (we will not), but because I'm sure in 5 years we will be much better than if they succeed. For majority of Australians (especially our kids) going into few years long recession in 2013 is much better option than going into decade long deep depression in 2018.

I hope, we learned something from other's mistakes.

Thursday, June 21, 2012

Census and Australian housing shortage/oversupply

Preliminary Census data is published a few days ago - census link, and as I expected it just confirmed some of my projections.

 First, couple of general (non housing) findings:

  • Total population increased to 21.5m, while total number of dwelling increased to 9.1m.
  • Population growth over the last 5 years was lower than projected (around 300k less – 60k less per year)
  • Household size remained stable at 2.6
  • 65+ is the fastest growing population group
  • Median household income was $64k

Housing data is also interesting.

Ownership rate decreased from 68.1% to 67%. Outright ownership decreased from 34% to 32.1%. Percentage of mortgage owners and renters who spend more than 30% of income on housing increased as well. Income increased only 20% while house prices increased 33.3%, and median mortgage repayment 38% over the previous 5 years. Although income and repayment census data is not very reliable, this suggests that housing became less affordable.

Percentage of unoccupied dwellings increased from 10.4% to 10.7%. Total number of households increased by 616k; number of private dwellings increased by 720k. More than 100k dwellings that were built since 2006 are not occupied. One new dwelling was built for every 2.3 new residents while average household size stayed 2.6.

All this suggests that there is no housing shortage in Australia. In fact, it suggests that oversupply of homes increased in 5 years. The oversupply increase since 2006 seems to be higher than what I predicted here. The likely reasons for this are wrong population growth estimates and my methodology that tends to underestimate oversupply. This means that current oversupply most likely exceeded one million homes.

Oversupply of homes is significantly up, price to income ratio is up, demography is getting worse, …  It seems that there is nothing about real demand and supply that can drive house prices up (or support current prices). It is all down to speculative demand and credit availability. 

Friday, April 13, 2012

Why we are so different - according to RBA

RBA head of financial stability, Luci Ellis, delivered few days ago a speech at Financial Markets Conference in Atlanta. Ms Ellis “explained” why the US housing market bubbled and then busted, and why the Australian housing market will not burst. She made several arguments why we are different. All of them wrong. I will concentrate here on two points:
The first is that housing supply is quite elastic here, at least in enough parts of the country to matter. The housing boom was a construction boom as well as a price boom. As a result, by 2006 there was already a substantial overhang of excess supply (Graph 1).  The inherent stock-flow interaction in the housing market means that construction booms sow the seeds of their own destruction. Prices can undershoot formerly sustainable levels.  
US construction in 2000s was (in nominal terms) lower than in 1970s and 1980s. In relative terms (relative to population or total existing housing stock) construction rate at the peak in mid 2000s was by far lower than in all previous decades.

Posted Image

This is what she calls US “construction boom”. During the same period we were building at the rate of almost 2%.

More interestingly, in states where developments were restricted construction “boom” was lower while bubble was bigger. Supply side restrictions just amplify house price growth but don’t stop prices from falling. Places with the most supply restrictions (Las Vegas, California …) recorded largest house price drops although none of supply restrictions was lifted in meanwhile. Places with no restrictions like Texas or Georgia recorded no price growth.

This links to the third factor, which is that a range of tax and legal differences, as well as industry convention, created a system that discouraged amortisation. Interest-only loans, explicitly negative amortisation loans and cash-out refinancing, all meant that loan-to-valuation ratios that were high at origination, stayed high well into the life of the loan. American households are less likely to pay their mortgages down ahead of schedule than Australians (Graph 2). Trade-up buyers seem to have high loan-to-valuation ratios in the United States; that doesn't appear to be true in Australia. The result of all this is that the US housing stock is far more leveraged than that in Australia, even during the boom period (Graph 3).

While it's true that Australia does not provide tax benefits for PPOR mortgages it provides significant benefits for property investments. Americans have interest in not paying mortgages ahead of schedule, while Australians don’t. Even with this “advantage” Australians managed to increase LVR during housing boom while Americans decreased it. Australians were adding more debt and much faster (relative to home prices) than they are able to repay ahead of schedule. So, we are paying mortgage faster but or those mortgages grew so quickly that debt is skyrocketing.

Posted Image

Australia has higher percentage of interest only loans which shows that less people in Australia are interested in owning house – these people only think about price speculation. Since boom started we increased out leverage by almost 50% while Americans decreased their leverage during boom years (by almost 10%). After house price fell US leverage jumped up to level almost 50% higher than pre-boom levels. When our bubble bursts leverage will jump to levels at least 150% higher than  pre-boom period (probably 200% or even more). It’s already 50% up.

RBA is already left with very little credibility and this is just one more step toward losing all of it.

Wednesday, February 8, 2012

Market Inventory vs Bubble Burst

There is strong belief among Australians that housing market will not crash because majority people will not be willing or forced to sell for reduced price. Although it is true that majority of people will not sell at low price, there is misconception how many forced or willing sellers is necessary to crash the market.


Let's see behaviour of market stock in Australia over the past 5 years or so:


Chart1 Stock on the market RPdata
 From the chart, we can see that number of homes for sale doubled since first housing troubles started in 2008. Stock slightly decreased during short boom in late 2009 - early 2010 but increased 50% since then. Similar data comes from SQM - Chart 2
Chart2 - Stock on the market SQM
 From observation of a recent events in USA, I noticed that significant rise in inventories is not needed for price to crash. If we take a look at US existing house inventories (Chart 3) we can clearly see that inventories didn't increased more than inventories in Australia.
Char3 - US existing home inventory

From the chart we can see that home inventories in USA at the peak were lower than current inventory in Australia. At the peak inventories were only about 4% of total housing stock, while that percentage already passes 4.5% in Australia.  It is hard to say that 4% of the total stock is extreme number that caused 33% price crash in USA. We should also notice that stock on the market fell in late 2008 early 2009 when house prices dropped the most. This means there is something else that significantly affects house prices.

Lets take a look at sales:

Chart4 - US home sales
It is clear that drop in sales, significantly affected housing market in USA. Lack of buyers seems to have much larger effect on price than rise in inventories. It is expected there will always be significant number of people forced or willing (for any reason) to sell, but it's hard to expect significant number of buyers (especially if credit freezes and/or unemployment hits).

Let's see whether this holds in Australia

 
Chart 5 - Australia home sales
 It is clear that house price fall in 2008/2009 was caused by significant fall in sales. House prices recovered driven by new buyers although stock on market remained elevated compared to pre 2007 levels.

It looks like inventory levels at the moment are more than enough to enable market crash, it's up to buyers to set market direction. Recent drop in sales (since 2010) is larger than drop recorded in USA during the first two years of price contraction. If soon buyers do not return to the market in large numbers, we may expect price fall to accelerate. There is no need for mass panic sale for prices to fall significantly.